

Some Highlights for Travelers
By the Bureau of Transportation Statistics
Cancellations: The 12 airlines that report on-time data to BTS posted an all-time annual low cancellation rate of 1.17 percent in 2016, the lowest rate in 22 years of comparable numbers since 1995. That rate was down from 1.54 percent in 2015 and below the previous record of 1.24 percent in the post 9/11 year of 2002. In September, the airlines set a record low cancellation rate for any month at 0.33 percent. Two months later, in November, the record all-time-low record was broken again at 0.29 percent.
For the year, airlines reported that 52 percent of cancellations were caused by weather, 31 percent were due to circumstances within the airline’s control and 17 percent were due to the National Aviation System, a broad set of factors, such as non-extreme weather conditions, airport operations, heavy traffic volume, and air traffic control.
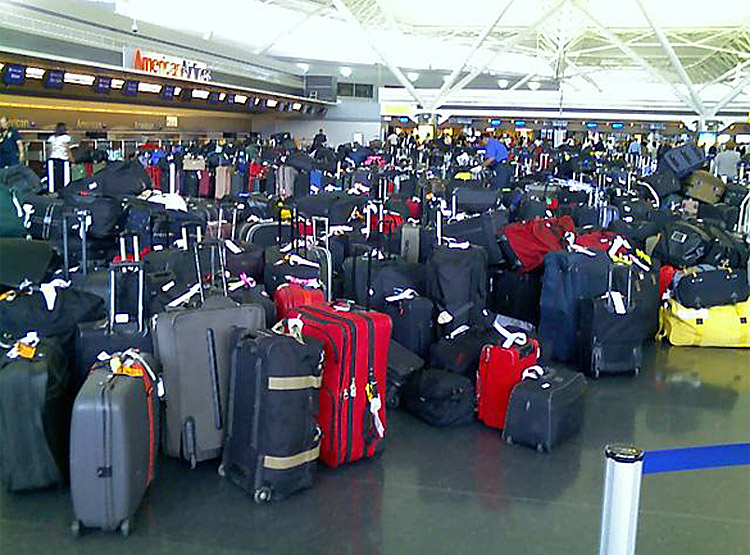
Mishandled Baggage Reports: The airlines set an annual low mishandled baggage report rate of 2.70 per 1,000 passengers, the lowest annual rate since the U.S. Department of Transportation (US DOT) started collecting mishandled baggage report data in 1987. That rate was down from 3.13 per 1,000 passengers in 2015 and below the previous record of 3.09 per 1,000 passengers 2012.
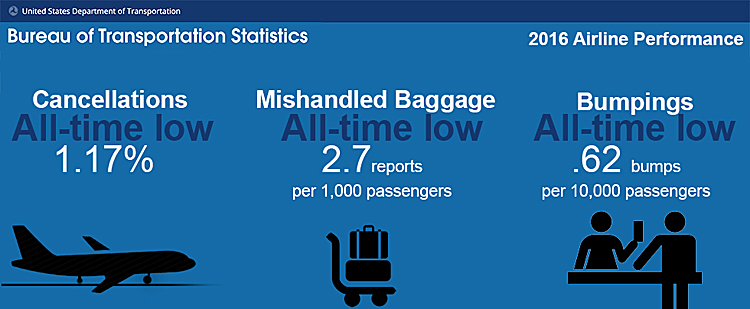
Bumpings: The airlines set an annual low bumping rate of 0.62 per 10,000 passengers, the lowest annual rate since 1995, the earliest available DOT records. That rate was down from 0.73 per 10,000 passengers in 2015 and below the previous record of 0.72 per 10,000 passengers 2002.
Seven airlines reported lower bumping rates in 2016 than in 2015 – SkyWest, Frontier, ExpressJet, United, American, Southwest and Delta. Despite an increase in bumping rates from 2015 to 2016, Hawaiian maintained its rank as the airline with the lowest bumping rate.
For the year, Hawaiian, Alaska and Delta had the highest on-time arrival rates while Spirit, JetBlue and Frontier had the lowest.
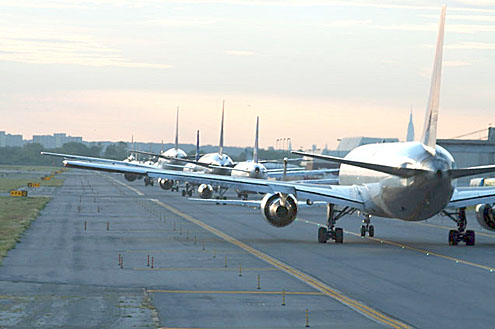
Tarmac Delays: Less promising for fliers was the increase in lengthy tarmac delays. There were 120 lengthy tarmac delays in 2016, more than in any year since 2013 when there were 139. There were fewer in the intervening years – 39 in 2014 and 76 in 2015.
For the full year 2016, there were 84 domestic flights on the tarmac for more than three hours and 36 international flights on the tarmac for more than four hours.
For more information, see the February Air Travel Consumer Report, BTS’ Flight Delays at-a-Glance and BTS’ Airline On-Time database.