By Zach Friend, Santa Cruz County Board of Supervisors, Second District
Recently, the Board of Supervisors received a report from the Equal Employment Opportunity Office which is charged to provide an analysis of the county workforce and how it compares to the local metropolitical statistical area.
The report looks at the County government’s workforce by gender and race/ethnicity, identifies and describes the County’s outreach and recruitment strategies for populations where there is a gap between the available workforce and the County workforce composition, and outlines specific steps to promote equal employment opportunity for federally-designated protected classes.
What Did The Report Show?
The report provided a detailed comparison of the demographic composition of the Countywide workforce at three points in time: 2009, 2014 and 2022.
Overall, the diversity of the County workforce continues to increase and in many categories is higher (and in some cases significantly higher) than percentage of those available in the countywide workforce composition.
Here are some specific examples:
Women constitute nearly 60% of the County workforce, far exceeding the percentage composition of women in the Santa Cruz County area workforce.
In the category of Officials and Administrators (top positions within the County), the representation of women increased from 53% in 2009 to 62% in 2022. This compares to 44% of women in those positions across all sectors countywide.
In the Protective Services category (which includes the Sheriff’s Office, for example), the representation of women has increased from 26% to 31% since 2009 — compared to 15% in those positions across all other Protective Services countywide.
Since 2009, representation of men within the County government’s workforce has remained around 41%.
For specific demographic groups, the County also exceeds the local demographic makeup of the available workforce.
For example, within the Santa Cruz County Core-Based Statistical Area (which is what the American Community Survey uses to determine local demographic makeups of the population and available workforce), Hispanic/Latinos made up 25% of the community/available workforce but 43% of the County workforce.
Overall, the report showed that our community consists of approximately 35% of non-white workforce composition but the County workforce consists of 52% — significantly more.
Where Are There Needs For Improvement?
In addition, the report also looks at specific occupational categories to see how that compares.
While the overall diversity of the County workforce exceeds that of the local available workforce, there are some occupational categories in which the County falls below these groups’ representation in the local available labor market.
For example, in the Service and Maintenance category, women constitute about 20% of the County workforce but 43% of the local labor pool for that category and men also fall below in multiple categories including Officials and Administrators, Administrative Support and Technician categories.
Interested In Learning More About The Report?
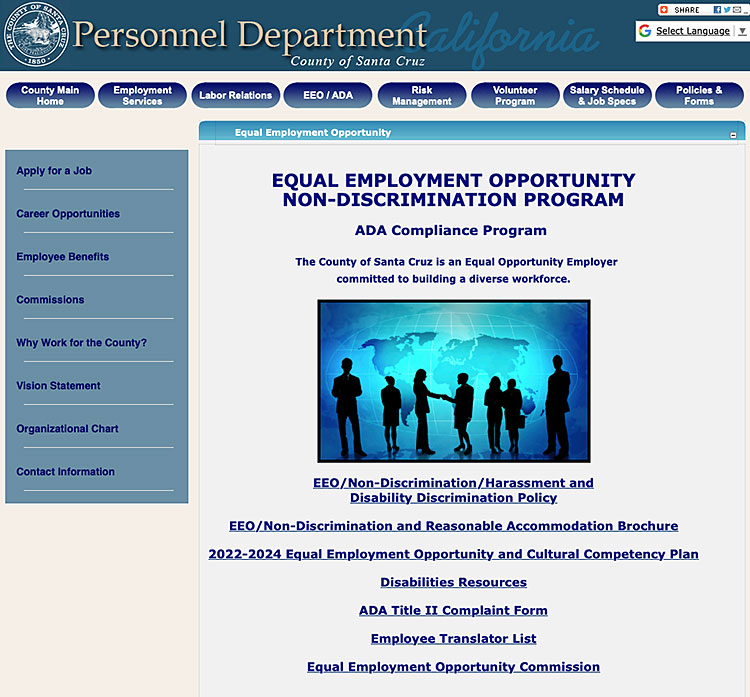
More information about the County’s Equal Employment Opportunity Plan and report to the Board can be found on the Personnel website — which is at www.santacruzcounty.us (click on Personnel and then EEO).
•••
As always, I appreciate your feedback. I’m maintaining regular updates on social media at www.facebook.com/supervisorfriend and you can always call me at 454-2200.


