


San Francisco Area – April 2015
Area prices up 2.5 percent from a year ago
Prices in the San Francisco area, as measured by the Consumer Price Index for All Urban Consumers 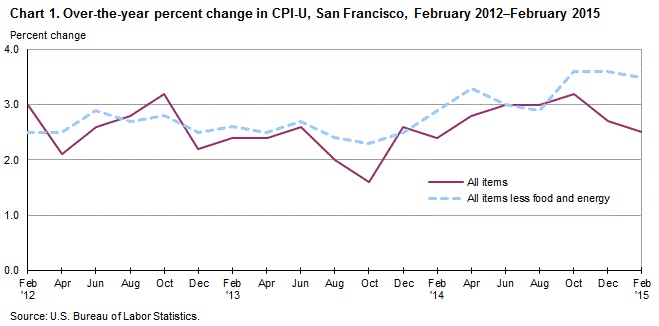
Over the last 12 months, the CPI-U increased 2.5 percent. Energy prices fell 14.9 percent, largely the result of a decrease in the price of gasoline. The index for all items less food and energy increased 3.5 percent over the year. (See table 1.)
Food – Food prices advanced 0.9 percent for the two months ending in February. (See table 1.) Prices for food at home and food away from home both advanced 0.9 percent for the same period.
Over the year, food prices rose 4.0 percent. Prices for food at home advanced 4.9 percent since a year ago, and prices for food away from home moved up 2.9 percent.
Energy – The energy index edged down 0.1 percent for the two months ending in February. The decrease was mainly due to lower prices for gasoline (-3.2 percent). Prices for natural gas service rose 4.7 percent, and prices for electricity increased 4.1 percent for the same period.
Energy prices fell 14.9 percent over the year, largely due to lower prices for gasoline (-25.3 percent). Prices paid for natural gas service increased 9.9 percent, and prices for electricity advanced 0.3 percent during the past year.
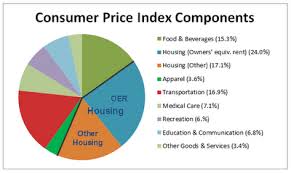
All items less food and energy – The index for all items less food and energy increased 1.1 percent in the latest two-month period. Higher prices for apparel (6.2 percent), education and communication (1.4 percent), and shelter (1.1 percent) were partially offset by lower prices for other goods and services (-0.8 percent) and recreation (-0.2 percent).
Over the year, the index for all items less food and energy increased 3.5 percent. The largest component contributing to the increase was housing (5.3 percent). Partly offsetting the increase were price declines in education and communication (-0.5 percent) and other goods and services (-0.5 percent).