By Gary Griggs, Distinguished Professor of Earth and Planetary Sciences and Director of the Institute of Marine Sciences at UCSC
Somewhere around 8,000 years ago, however, sea level rise slowed, and rose relatively little until the late 1800s. The industrial revolution began at about that time, as coal and then oil and gas were exploited for fuels that were utilized to produce heat and energy for factories and transportation. These fossil fuels, or the preserved remains of terrestrial plants (coal) and marine plants (petroleum), represented highly concentrated sources of carbon that generated heat when burned. Burning these fossil fuels, however, also generated large amounts of carbon dioxide.

What does all of this have to do with sea level? There is now a clearly established relationship between carbon dioxide content of the atmosphere and the Earth’s temperature, and a close connection between global temperatures and sea level. The warmer the Earth, the more ice melts and the more seawater expands, both raising sea level.
After about 8000 or so years of a relatively constant sea level, as best we can tell from the fossil record of ancient shorelines, sea level began to rise again.
As the carbon dioxide content of the atmosphere began to increase in the late 1800s, global temperatures slowly rose, and sea level followed.
These instruments were installed to provide accurate information on water depths and how these changed over time so ships could enter and leave ports safely. Each gage is anchored on some structure, a concrete breakwater or wharf, a rock outcrop, or some other solid foundation that is stable over long periods of time.
As time went on, however, and the sea level records were studied, two things became clear: 1] Not only was the level of the ocean changing daily as the tide went in and out, but sea level was also rising globally; and 2] sea level was not changing uniformly everywhere.
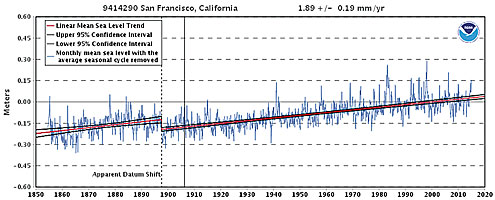
Each of these official gages, and there are now hundreds of these along coastlines around the world (go to: http://tidesandcurrents.noaa.gov/sltrends/sltrends.shtml and you can look at sea level records for any tide gage) that track sea level at specific coastal locations. Many coastal areas are not stable, however; some are sinking (New Orleans and Venice, for example), and some are rising (Alaska and Scandinavia, for example). You can check the website listed above for these and other locations. Each tide gage keeps track of how sea level is changing relative to the particular area of land it is anchored on.
Sea level rose globally about seven inches from the late 1800s to the late 1900s, or at an average rate of about 1.7 millimeters/year (the thickness of a quarter). This is a global average, however, because some coastlines are rising and some are sinking. These geographic variations were resolved in 1993 when two satellites were launched into orbits high above the Earth. They use radar and GPS technology to measure the level of the ocean from space very precisely. This high-tech approach eliminates the problem of land motion on Earth and has given us a new and higher global sea-level rise rate since 1993 of 3.2 millimeters per year, or 12 inches per century.